Tamara Last MSc, VU University Amsterdam
May 2015
Download this article in PDF format.
The results below are based on the visualization version of the Deaths at the Borders Database for the Southern EU. In this simplified version, confirmed nationalities were combined with assumed origins based on place of birth or estimated race/ethnicity, and categorized under 5 regions (North Africa, Sub-Saharan Africa, Middle East, Asia and the Balkans); where the sex was missing from the records of identified persons and the gender of the given name was easily apparent, the sex was added; where the identification was not clear (only a first name or multiple/“possible” identities were recorded) the case was marked as unidentified; and the average of the estimate age range was used.
Overview
The Deaths at the Borders Database for the Southern EU records 3188 people found dead by local authorities in Greece, Malta, Italy, Gibraltar and Spain from 1/1/1990 to 31/12/2013.
Graph 1 shows the number of deaths along the southern EU borders over time and the country where the bodies were brought or found. As can be seen, there has been an overall increase in the 2000s as compared with the 1990s, but the numbers fluctuate from year to year.
The sharp increase in 2013 is due to the shipwreck of the 3rd of October 2013 very close to Lampedusa (Italy), which – due to its close proximity to the island and the national and international attention the incident attracted – triggered a massive operation to recover bodies from the water and the sea floor. Such large-scale operations involving national authorities are not common with regard to incidents involving irregular migrants at sea or in crossing land borders; usually only a few bodies are found and many more may remain missing.
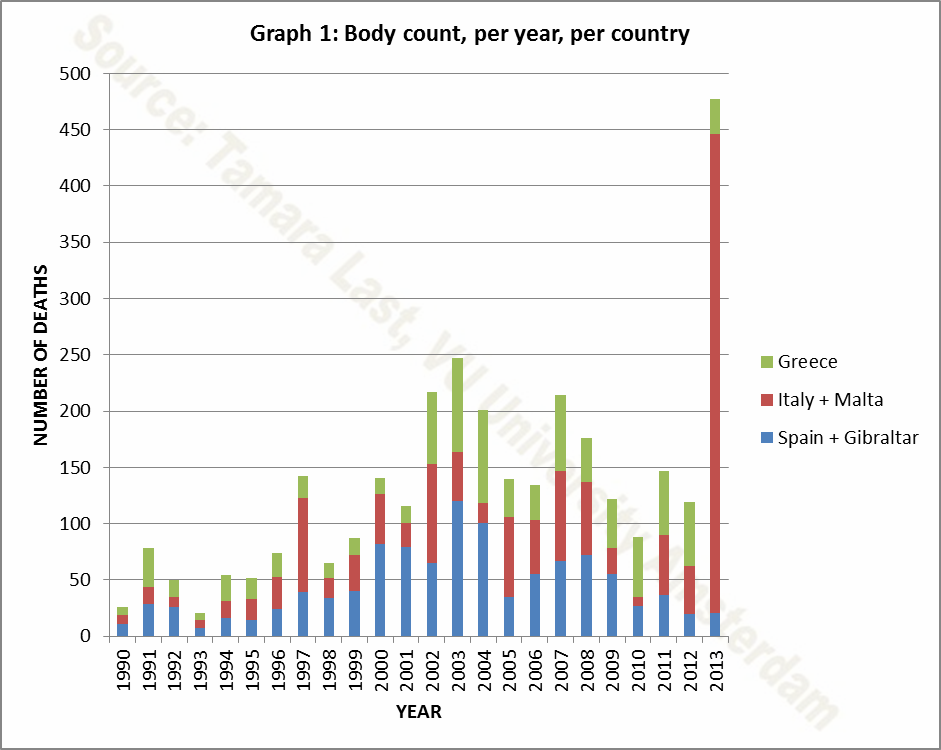
Table 1 provides an overview of the population in the Database by sex, origin, age and cause of death. The majority (72%) of persons recorded in the database are male. The most common known or assumed region of origin is Sub-Saharan Africa (which includes the Horn of Africa), although it is important to note that in more than one third (41%) of cases, the region of origin is unknown and could not be guessed. Border deaths occur most frequently among young adults between 20-40 years of age; this age group accounts for 53,5% of cases where the age was known or estimated, and it is likely many of the unknown cases are within this age group as well. The cause of death of the majority (62%) of people who die attempting to cross the external borders of the southern EU is drowning, in the sea or in the Evros River.
| Table 1: Population characteristics of the Deaths at the Borders Database for Southern EU, N=3188 | ||
| Sex | Count | % of Total |
| male | 2282 | 71,6% |
| female | 404 | 12,7% |
| unknown | 502 | 15,7% |
| Origin | ||
| North African | 572 | 17,9% |
| Sub-Saharan African | 751 | 23,6% |
| Middle East | 156 | 4,9% |
| Asia | 192 | 6,0% |
| Balkan | 214 | 6,7% |
| unknown | 1303 | 40,9% |
| Age | ||
| Under 10 | 65 | 2,0% |
| 10 to 19 years | 190 | 6,0% |
| 20 to 29 years | 1239 | 38,9% |
| 30 to 39 years | 467 | 14,6% |
| 40 to 49 years | 112 | 3,5% |
| 50 years and over | 49 | 1,5% |
| unknown | 1066 | 33,4% |
| Cause of death | ||
| Drowning | 1977 | 62,0% |
| Dehydration | 67 | 2,1% |
| Cardiorespiratory arrest | 76 | 2,4% |
| Hypothermia | 145 | 4,5% |
| Injuries/violence | 116 | 3,6% |
| Suffocation | 51 | 1,6% |
| Unknown | 756 | 23,7% |
Comparison with existing data
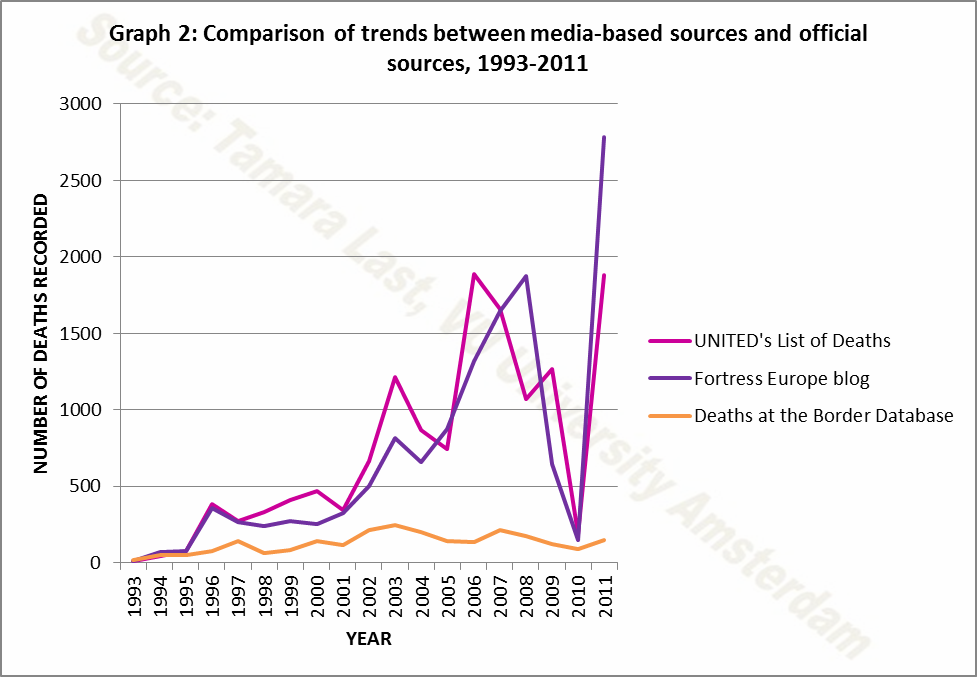
Graph 2 compares the deaths recorded in the Deaths at the Borders Database for Southern EU with the lists of border deaths created by UNITED Against Racism and Fortress Europe blog by tracking reported deaths in the news media. I adjusted the UNITED and Fortress Europe lists for the period 1993-2011 to fit a common definition of ‘border death’ with the Deaths at the Borders Database (namely, people who have died attempting to enter the southern EU Member States without authorization). For a comparative description of available data on border deaths in the Mediterranean, see our chapter in the Fatal Journeys report (pp.85-106).
The much higher total numbers of the UNITED and Fortress Europe lists are due to the fact that the Deaths at the Borders Database only records a death when the body was found by European authorities. However, each of the three resources contains cases that have not been recorded by the others and vary in the degree of information available about the cases they have in common. In general, UNITED and Fortress Europe focus on the incidents (eg shipwrecks), whereas the Deaths at the Borders Database focuses on the individuals who died in such incidents and whose bodies were recovered.
Graph 2 shows starkly different trends, however: while Fortress Europe and UNITED lists demonstrate a sharp increase in deaths over the period 1993-2011, the Deaths at the Borders Database shows that the numbers of bodies recovered has increased in the 2000s from the 1990s but not as dramatically. The dramatic drop in deaths reported by the media in 2010 is not mirrored by the number of bodies found. I will do further analysis to determine whether these differences can be explained as a result of fluctuating media attention to the issue.
Identification
One of the most glaring findings of the Deaths at the Borders Database is the fact that almost two thirds (2073 people, 65%) of the people recorded have not been identified by the local authorities charged with investigating their deaths.
Table 2 provides an overview of the sex, age, origin and cause of death of the identified and unidentified. Identification is lowest among people of presumed Sub-Saharan African origin. It may be expected that identification is easier among people who come from countries that neighbour the EU (North Africa, the Balkans, the Middle East), due to the proximity of family members and closer community and official ties. However, the identification rate for Sub-Saharan Africans is low even compared to the identification rate among Asians. Of course, it must be noted that among the unidentified, these origins are only guessed, based on the testimony or known origin of travel companions or on the colour of their skin and their features.
Children as well as people over the age of 40 are marginally more likely to be identified than the majority of people who die, who are between the ages of 20-40 (chi-square=18.861, df=2, p<0.001). One possible explanation may be because children and older adults are more likely to travel with relatives who – if they themselves survive the journey – would be available to the local authorities to aid with identification.
| Table 2: Characteristics of unidentified and identified persons recorded in the Deaths at the Borders Database for Southern EU (N=3188) | ||||
| Sex | Total Count | Unidentified Count (n=2073) | Identified Count (n=1115) | % Identified of Total Count |
| male | 2282 | 1435 | 847 | 37,1% |
| female | 404 | 279 | 125 | 30,9% |
| unknown | 502 | 359 | 143 | 28,5% |
| Origin | ||||
| North African | 572 | 113 | 459 | 80,2% |
| Sub-Saharan African | 751 | 587 | 164 | 21,8% |
| Middle East | 156 | 45 | 111 | 71,2% |
| Asia | 192 | 99 | 93 | 48,4% |
| Balkan | 214 | 18 | 196 | 91,6% |
| unknown | 1303 | 1211 | 92 | 7,1% |
| Age | ||||
| Under 10 | 65 | 31 | 34 | 52,3% |
| 10 to 19 years | 190 | 87 | 103 | 54,2% |
| 20 to 29 years | 1239 | 700 | 539 | 43,5% |
| 30 to 39 years | 467 | 256 | 211 | 45,2% |
| 40 to 49 years | 112 | 48 | 64 | 57,1% |
| 50 years and over | 49 | 19 | 30 | 61,2% |
| unknown | 1066 | 932 | 134 | 12,6% |
| Cause of death | ||||
| Drowning | 1977 | 1389 | 588 | 29,7% |
| Dehydration | 67 | 53 | 14 | 20,9% |
| Cardiorespiratory arrest | 76 | 37 | 39 | 51,3% |
| Hypothermia | 145 | 109 | 36 | 24,8% |
| Injuries/violence | 116 | 56 | 60 | 51,7% |
| Suffocation | 51 | 37 | 14 | 27,5% |
| Unknown | 756 | 392 | 364 | 48,1% |
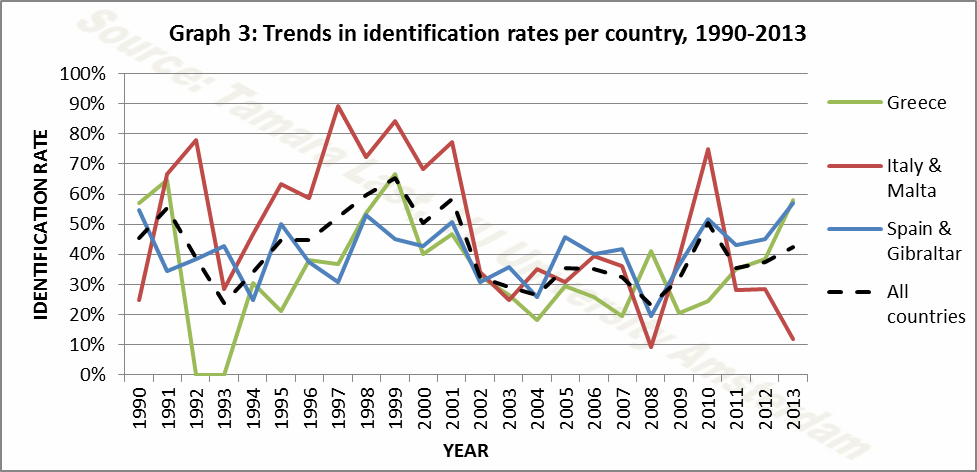
Graph 3 shows identification rates in different countries over time. There has been an overall decline in identification rates since 2000. This may be due to the higher numbers of bodies that local authorities have to deal with as observed in Graph 1. The reduction in identification rates may also reflect shifts in the people who attempt to cross the external EU borders without authorization (for example, less people originating from neighbouring countries), or an increased indifference to the phenomenon among local officials and their national counterparts. I will explore the question of why there are such low rates of identification among border deaths in a forthcoming chapter to be published by early 2016. But qualitative data from our pilot studies and anecdotal evidence from others researching migrant deaths in the EU suggests that much more could be done by European authorities to identify more people who die attempting to cross the external borders.
Relation with migration and border policies
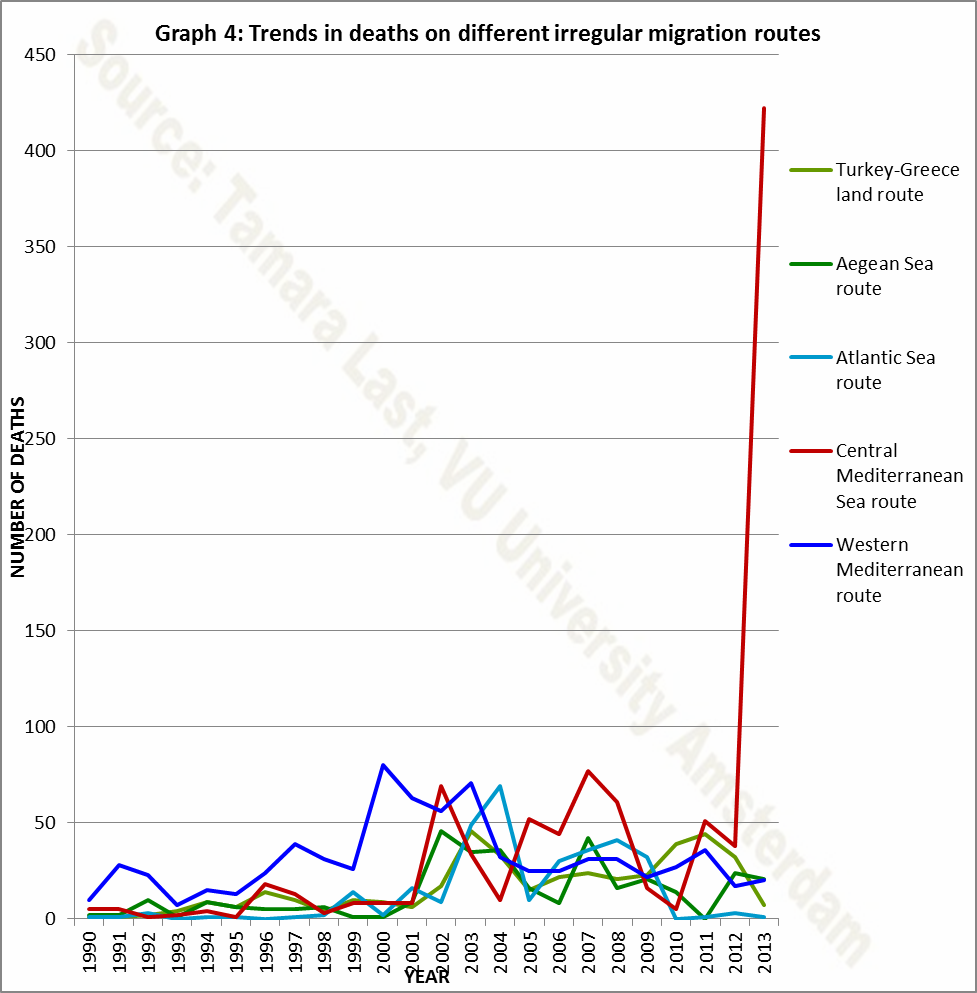
The creation of the Deaths at the Borders Database for Southern EU is the first step in researching the relationship between migrant mortality and European border policies. Graph 4 is an example illustrating why the relationship between migrant mortality and European border policies is worth exploring.
Graph 4 shows the trends in body counts on a selection of different routes. The graph illustrates how the number of deaths on one route seems to reduce around the same time that they increase on a different route. For example, look at the relation between the Western Mediterranean route and the Atlantic route in 2004 (deaths in the Western Mediterranean drop as deaths reach their peak on the Atlantic route), and again from 2010-2011 (deaths in the Western Mediterranean begin to climb as deaths in the Atlantic drop close to 0). Another example is the relation between the Turkey-Greece land and sea borders: in 2011 the number of deaths in the Aegean drops dramatically and rises at the Turkey-Greece land border. More generally, Graph 4 shows that in the 1990s and early 2000s deaths were occurring most frequently on the Western Mediterranean route, but for the period 2005-2008 and since 2011 there have been more bodies found in the Central Mediterranean.
These observations are very preliminary, but point towards an already common hypothesis that border control diverts irregular migrants and border deaths, rather than preventing them. The next step in my research is to determine the significance and nature of these hypothesized relations by calculating reliable mortality rates per route per year. Are some routes more dangerous than others? Has the risk of death increased or decreased over time, and what has been the influence of European border control policies and practices?
Pingback: Border Control and Shifting Routes: Syrian Refugees Moving Through Egypt - The Tahrir Institute for Middle East Policy